With the free ArcSight Logger L750MB, you can in combination with auditd SmartConnector, gather some useful informations in order to have a better overview on your Unix infrastructure Access Management or to respond to some compliances (ex : PCI-DSS, etc.).
In this blog post we will show some examples on how use ArcSight Logger search engine and visualisation capabilities.
Unix Auditd authentication events analysis
We will first analyse Unix auditd authentication events in order to understand what useful informations we can find.
We assume that login under root account is not allowed and that 500 represent the first usable user account.
We will describe here under different SSH authentication auditd events with they results. You can find in bold some important keywords.
- Successful SSH authentication auditd events
type=USER_AUTH msg=audit(1316335353.969:348): user pid=32370 uid=0 auid=4294967295 msg='PAM: authentication acct="eromang" : exe="/usr/sbin/sshd" (hostname=macbook.zataz.loc, addr=192.168.178.25, terminal=ssh res=success)'

type=USER_LOGIN msg=audit(1316335353.991:355): user pid=32370 uid=0 auid=500 msg='uid=500: exe="/usr/sbin/sshd" (hostname=macbook.zataz.loc, addr=192.168.178.25, terminal=/dev/pts/0 res=success)'
- Failed SSH authentication, for a valid user account, auditd events
type=USER_AUTH msg=audit(1316335438.989:362): user pid=32395 uid=0 auid=4294967295 msg='PAM: authentication acct="eromang" : exe="/usr/sbin/sshd" (hostname=macbook.zataz.loc, addr=192.168.178.25, terminal=ssh res=failed)'

type=USER_LOGIN msg=audit(1316335438.990:363): user pid=32395 uid=0 auid=4294967295 msg='acct="eromang": exe="/usr/sbin/sshd" (hostname=macbook.zataz.loc, addr=192.168.178.25, terminal=sshd res=failed)'
- Failed SSH authentication, for non existing user account, auditd events
type=USER_AUTH msg=audit(1316335506.816:372): user pid=32403 uid=0 auid=4294967295 msg='PAM: authentication acct="?" : exe="/usr/sbin/sshd" (hostname=macbook.zataz.loc, addr=192.168.178.25, terminal=ssh res=failed)'

type=USER_LOGIN msg=audit(1316335506.817:373): user pid=32403 uid=0 auid=4294967295 msg='acct="invaliduser": exe="/usr/sbin/sshd" (hostname=macbook.zataz.loc, addr=192.168.178.25, terminal=sshd res=failed)'
- Successful TTY authentication auditd events
type=USER_AUTH msg=audit(1316338747.834:381): user pid=2678 uid=0 auid=4294967295 msg='PAM: authentication acct="eromang" : exe="/bin/login" (hostname=?, addr=?, terminal=tty1 res=success)'

type=USER_LOGIN msg=audit(1316338747.867:437): user pid=2678 uid=0 auid=500 msg='op=login id=500 exe="/bin/login" (hostname=?, addr=?, terminal=tty1 res=success)'
- Failed TTY authentication, for a valid user account, auditd events
type=USER_AUTH msg=audit(1316338880.990:495): user pid=32452 uid=0 auid=4294967295 msg='PAM: authentication acct="eromang" : exe="/bin/login" (hostname=?, addr=?, terminal=tty1 res=failed)'

type=USER_LOGIN msg=audit(1316338880.990:496): user pid=32452 uid=0 auid=4294967295 msg='op=login id=500 exe="/bin/login" (hostname=?, addr=?, terminal=tty1 res=failed)'
- Failed TTY authentication, for non existing user account, auditd events
type=USER_AUTH msg=audit(1316338916.360:497): user pid=32452 uid=0 auid=4294967295 msg='PAM: authentication acct="?" : exe="/bin/login" (hostname=?, addr=?, terminal=tty1 res=failed)'

type=USER_LOGIN msg=audit(1316338916.360:498): user pid=32452 uid=0 auid=4294967295 msg='op=login acct="invaliduser" exe="/bin/login" (hostname=?, addr=?, terminal=tty1 res=failed)'
For USER_LOGIN auditd type events you will have these results :
- Count of successful and failed authentication attempts (number of lines in the log).
- Targeted username through auditd “acct” value, but only for failed attempts.
- Targeted UID for successful and failed attempts through auditd “uid“, “id” and “auid” values.
- Targeted device address and hostname (box hosting the auditd.log file, or IP/hostname present in SYSLOG log file).
- Source address and hostname, only for remote authentication, through auditd “hostname” and “addr” values.
- Associated terminal through “terminal” value.
FOR USER_AUTH type you will have these results :
- Count of successful and failed authentication attempts (number of lines in the log).
- Targeted user name through auditd “acct” value, but only valid user accounts.
- Targeted device address and hostname (box hosting the auditd.log file, or IP/hostname present in SYSLOG log file).
- Source address and hostname, only for remote authentication, through auditd “hostname” and “addr” values.
- Associated terminal through “terminal” value.
In order to provide Access Management analysis, we will focus on USER_AUTH type. With this type we can detect regular authentications and authentication brute force attacks on valid users, with valid user name display, “acct” value.
Unix Auditd authentication events searches in ArcSight Logger
On ArcSight Logger we can now play with searches in order to retrieve and analyse auditd authentication events.
The following filter will provide you all Unix auditd events.
deviceVendor = "Unix" AND deviceProduct = "auditd"
The following filter will provide you all auditd USER_AUTH type events.
deviceVendor = "Unix" AND deviceProduct = "auditd" AND deviceEventCategory = "USER_AUTH"
In order to analyse Access Management activities, we need to understand how the SmartConnector is categorizing the auditd USER_AUTH event and gather the most important fields.
- baseEventCount : The number of occurrence of the event if aggregation is active on the SmartConnector.
- deviceAddress : Targeted device address
- deviceHostName : Targeted device hostname.
- sourceAddress : The attacker address.
- sourceHostName : The attacker hostname, if available.
- sourceUserName : The targeted authentication username.
- destinationProcessName : Targeted process name. “/usr/sbin/sshd” for SSH or “/bin/login” for TTY console in our cases.
- deviceCustomString3 : The authentication result. “success” or “failed” in our cases.
- deviceCustomString6 : For the associated terminal or tty. “ssh” or “ttyx” in our cases.
- deviceReceiptTime : The event associated timestamp.
In the following scenario, the target was under SSH brute force attack, and the attacker has gain access to the box. We will conduct an analysis, provide you some useful search queries and operators, and try to demonstrate you that using ArcSight Logger for forensics analysis is quiet easy.

This search query is based on the last 24 hours, and we can directly see through the Logger radar that a lot of USER_AUTH requests have been made. In order to only focus on the specific fields, we will execute the following query.
deviceVendor = "Unix" AND deviceProduct = "auditd" AND deviceEventCategory = "USER_AUTH" | cef deviceAddress deviceHostName sourceAddress sourceHostName sourceUserName destinationProcessName deviceCustomString3 deviceCustomString6 deviceReceiptTime baseEventCount
“cef” search operator will extracts values for specified fields from matching CEF events. To view only the extracted values, select “User Defined Fieldsets” in the search drill down menu. “cef” search operator will also allow you to use other search operators such as “sort“, “chart“, etc.

To focus on failed authentication attempts, execute the following query.
deviceVendor = "Unix" AND deviceProduct = "auditd" AND deviceEventCategory = "USER_AUTH" AND deviceCustomString3 = "failed" | cef deviceAddress deviceHostName sourceAddress sourceHostName sourceUserName destinationProcessName deviceCustomString6 deviceReceiptTime baseEventCount
To focus on successful authentication, execute the following query.
deviceVendor = "Unix" AND deviceProduct = "auditd" AND deviceEventCategory = "USER_AUTH" AND deviceCustomString3 = "success" | cef deviceAddress deviceHostName sourceAddress sourceHostName sourceUserName destinationProcessName deviceCustomString6 deviceReceiptTime baseEventCount
Browsing in the events is a quiet boring, ArcSight Logger provide you a query operator how will permit you to create visualisations with your search results.
- Chart creation to count sourceUserName occurrences
Don’t forget that USER_AUTH auditd type don’t provide the targeted user name for non existing users, so we will only focus on existing sourceUserName.
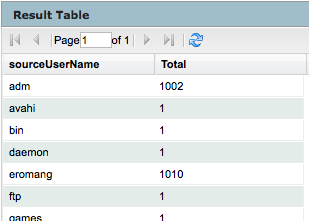
deviceVendor = "Unix" AND deviceProduct = "auditd" AND deviceEventCategory = "USER_AUTH" AND sourceUserName IS NOT NULL | cef deviceAddress deviceHostName sourceAddress sourceHostName sourceUserName destinationProcessName deviceCustomString3 deviceCustomString6 deviceReceiptTime baseEventCount | chart sum(baseEventCount) AS Total by sourceUserName

Associated to the result chart, you will also have a result table.

You can also, change the type of chart, by clicking on the upper right corner icon of the result chart frame. The available chart type are column, bar, pie, area, line, stacked column or stacked bar.

- Chart creation to count Terminal occurences
deviceVendor = "Unix" AND deviceProduct = "auditd" AND deviceEventCategory = "USER_AUTH" AND sourceUserName IS NOT NULL | cef deviceAddress deviceHostName sourceAddress sourceHostName sourceUserName destinationProcessName deviceCustomString3 deviceCustomString6 deviceReceiptTime baseEventCount | chart sum(baseEventCount) AS Total by deviceCustomString6

We can see that majority of the authentications are through SSH and that some are through TTY.
- Chart creation to count sourceUserName and Terminal occurences
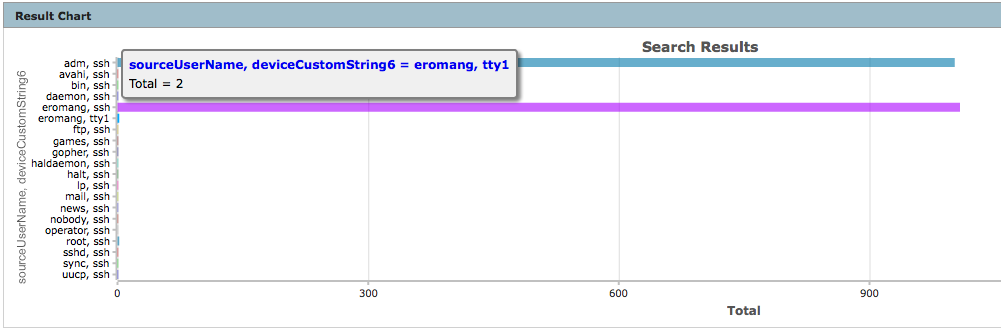
deviceVendor = "Unix" AND deviceProduct = "auditd" AND deviceEventCategory = "USER_AUTH" AND sourceUserName IS NOT NULL | cef deviceAddress deviceHostName sourceAddress sourceHostName sourceUserName destinationProcessName deviceCustomString3 deviceCustomString6 deviceReceiptTime baseEventCount | chart sum(baseEventCount) AS Total by sourceUserName deviceCustomString6

- Chart creation to count sourceUserName and authentication occurences
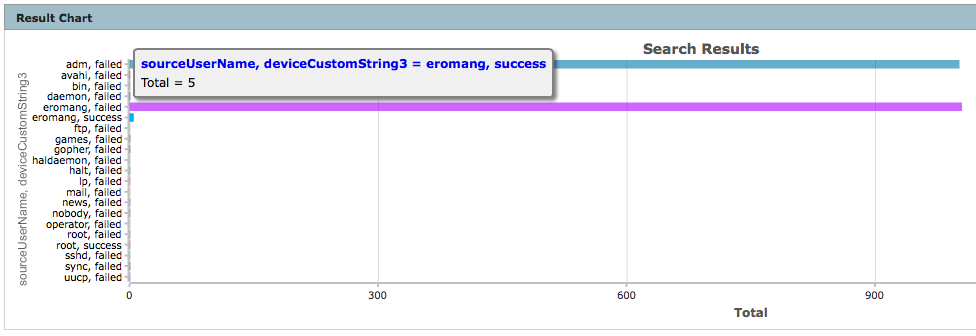
deviceVendor = "Unix" AND deviceProduct = "auditd" AND deviceEventCategory = "USER_AUTH" AND sourceUserName IS NOT NULL | cef deviceAddress deviceHostName sourceAddress sourceHostName sourceUserName destinationProcessName deviceCustomString3 deviceCustomString6 deviceReceiptTime baseEventCount | chart sum(baseEventCount) AS Total by sourceUserName deviceCustomString3

We can see that only user name “eromang” has successful login.
- Chart creation to count sourceUserName “eromang“, authentication and Terminal occurences
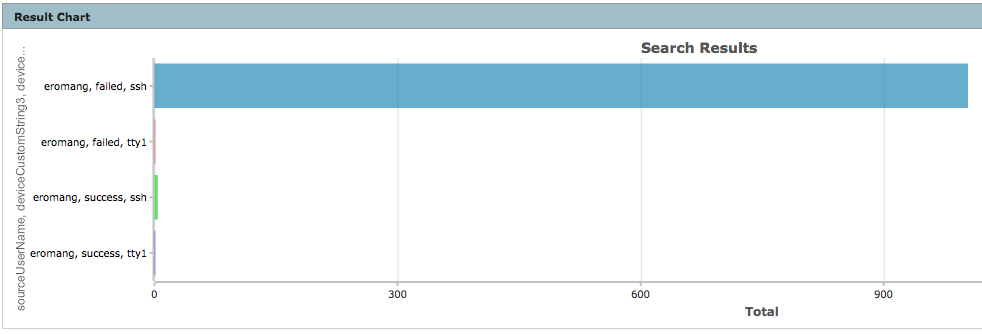
deviceVendor = "Unix" AND deviceProduct = "auditd" AND deviceEventCategory = "USER_AUTH" AND sourceUserName = "eromang" | cef deviceAddress deviceHostName sourceAddress sourceHostName sourceUserName destinationProcessName deviceCustomString3 deviceCustomString6 deviceReceiptTime baseEventCount | chart sum(baseEventCount) AS Total by sourceUserName deviceCustomString3 deviceCustomString6

We can discover that user name “eromang” has successful login through “ssh” and “tty” terminals.
- Chart creation to count sourceUserName “eromang” and successful authentication occurences
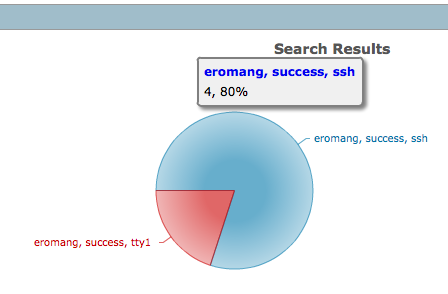
deviceVendor = "Unix" AND deviceProduct = "auditd" AND deviceEventCategory = "USER_AUTH" AND sourceUserName = "eromang" AND deviceCustomString3 = "success" | cef deviceAddress deviceHostName sourceAddress sourceHostName sourceUserName destinationProcessName deviceCustomString3 deviceCustomString6 deviceReceiptTime baseEventCount | chart sum(baseEventCount) AS Total by sourceUserName deviceCustomString3 deviceCustomString6

- Char creation to count sourceUserName “eromang”, successful “ssh” authentication and sourceAddress occurences
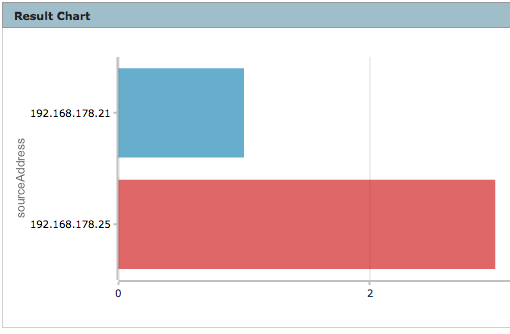
deviceVendor = "Unix" AND deviceProduct = "auditd" AND deviceEventCategory = "USER_AUTH" AND sourceUserName = "eromang" AND deviceCustomString3 = "success" AND deviceCustomString6 = "ssh" | cef deviceAddress deviceHostName sourceAddress sourceHostName sourceUserName destinationProcessName deviceCustomString3 deviceCustomString6 deviceReceiptTime baseEventCount | chart sum(baseEventCount) AS Total by sourceAddress

We can discover two different source IP addresses.
- Chart creation to count “ssh” authentications for both sourceAddress occurences
deviceVendor = "Unix" AND deviceProduct = "auditd" AND deviceEventCategory = "USER_AUTH"  AND (sourceAddress = "192.168.178.25" OR sourceAddress = "192.168.178.21")  AND sourceUserName = "eromang" AND deviceCustomString6 = "ssh"
| cef deviceAddress deviceHostName sourceAddress sourceHostName sourceUserName destinationProcessName deviceCustomString3 deviceCustomString6 deviceReceiptTime  baseEventCount | chart sum(baseEventCount) AS Total by deviceCustomString3 sourceAddress

We can discover that sourceAddress “192.168.178.21” has hundreds of failed login and one successful login.
- Query to find the exact time sourceAddress has breach the target
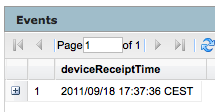
deviceVendor = "Unix" AND deviceProduct = "auditd" AND deviceEventCategory = "USER_AUTH" AND sourceAddress = "192.168.178.21" AND sourceUserName = "eromang" AND deviceCustomString6 = "ssh" AND deviceCustomString3 = "success" | cef deviceReceiptTime

As you can see by this example, ArcSight Logger has some powerful search engine queries and visualisation outputs how will help you to do forensics investigations for your assets.
