Category Archives: Security visualization

As networks become ever more complex, securing them becomes more and more difficult. The solution is visualization. Using today’s state-of-the-art data visualization techniques, you can gain a far deeper understanding of what’s happening on your network right now. You can uncover hidden patterns of data, identify emerging vulnerabilities and attacks, and respond decisively with countermeasures that are far more likely to succeed than conventional methods.

Analysis of Joomla wgPicasa component LFI source IPs

In a previous post, we have seen that Joomla wgPicasa component LFI exploit was more used than other LFI exploits. I was interested to see if the source IPs of this particular LFI attack was implicated into other attacks and integrated into bigger botnets.

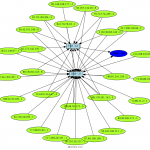
First of all, since the 15 April 2010, we have 165 different unique source IPs how have attempt to use the Joomla wgPicasa component LFI exploit on our HoneyNet. These source IPs have generate 20 351 events. Here under an afterglow representation of all these IPs with they weight in term of events.

165 source IPs calling SIG 2011067

Are these source IPs involved in other activities ? Surely yes 🙂 After some crazy SQL queries on our HoneyNet database, we got these results.

  • 45 others exploits where detected from the same source IPs who are exploiting the Joomla wgPicasa component LFI vulnerability.
  • Some of these 45 exploits are targeting others LFI exploits, for examples :
  1. Joomla Component com_ccnewsletter controller
  2. Ideal MooFAQ Joomla Component file_includer.php
  3. rgboard _footer.php skin_path parameter
  4. phpSkelSite TplSuffix parameter
  5. MODx CMS snippet.reflect.php reflect_base
  6. TBmnetCMS index.php content Parameter
  7. etc.
  • Some of these 45 exploits are targeting RFI exploits, for examples :
  1. ProdLer prodler.class.php sPath Parameter
  2. Datalife Engine api.class.php dle_config_api Parameter
  3. SERWeb main_prepend.php functionsdir Parameter
  4. Possible AIOCP cp_html2xhtmlbasic.php
  5. Mambo/Joomla! com_koesubmit Component ‘koesubmit.php’
  6. eFront database.php
  7. etc.
  • Some of these 45 exploits are trying SQL injection, for examples :
  1. MYSQL SELECT CONCAT SQL Injection
  2. SQL Injection Attempt UNION SELECT
  3. SQL Injection Attempt SELECT FROM

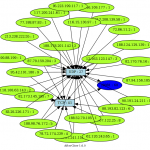
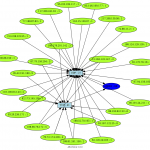
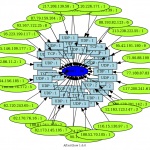
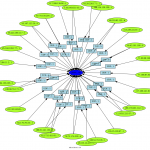
Here under an afterglow representation of the interactions between all source IPs and them attached exploits attempts.

All SIGs attached to the 165 SIG 2011067 source IPs

We can clearly see that most of these source IPs are controlled by Remote File Inclusion botnets, but some of them are standalone and only exploiting the particular Joomla wgPicasa component LFI.

Joomla wgPicasa component Local File Inclusion is in the hype

The 14 April 2010, Antisecurity has release a Joomla wgPicasa Component Local File Inclusion (LFI) exploit, published on Exploit Database as EDB-ID 12230. To attract the “bad guys” how will use this exploit, we published the 15 April a news containing, in the URL and the content of the news, some keywords to be the more attractive as possible 🙂 Most of the LFI scanners are using Google dorking methods to find a potential vulnerable target. So let get a good position in Google ranking.

Since the 15 April, we can see that this particular exploit is more targeted than other Local File Inclusion exploits, and the number of events are still increasing until we are one month after the exploit publication.

Joomla wgPicasa SIG 2011067 events for current month

Also, we have some source IP how are really trying to get in 🙂

TOP 10 source IPs exploiting Joomla wgPicasa SIG 2011067 during current month
TOP 20 source countries exploiting Joomla wgPicasa SIG 2011067

So, just one word, Joomla wgPicasa is in the hype, and really if you use Joomla, shutdown your server 🙂

Afterglow, relevant security information with visualization

Afterglow is a collection of scripts which facilitate the process of generating “linked graphs” or “network graphs”. The software is written in Perl, must be used on the command line, but quiet easy to use.

AfterGlow expects a CSV file as input and generates either an attributed graph langugage file that can be processed by the Graphviz libraries.

We will exercise us to use Afterglow with my previous post “Strange activities on 28081 and 47919 TCP/UDP destination ports” case.

To run afterglow, we need a CSV file, our first example has 3 rows : sources IP, protocol and destination port (how is 28081). The source IP will be the source data, the protocol the event, and the destination port the target.

We need also a configuration file named “color.properties” to configure the color output. Our will be very simple.

color.source=”greenyellow”
color.event=”lightblue”
color.target=”red”

To create your first afterglow visualization just lunch the following command.

cat 28081.csv | afterglow.pl -c color.properties -a -d -p 2 -e 3 | neato -Tpng -o 28081.png

Here under a gallery containing some afterglow results.

Exemple d’un maillage simple de réseau RFI

j’avais abordé dans un billet précédent une étude sur un RFI et le principe des attaques par intermédiaire. Cette étude se limitait sur une attaque avec simplement trois adresses IP impliquées (celle de l’attaquant, celle de la cible et celle de l’intermédiaire).

Ce qui est plus intéressant à faire est d’essayer de modéliser les réseaux RFI en place et leurs maillages. Ce billet traitera d’un exemple simple de maillage RFI.

82.194.87.219 situé à Bilbao en Espagne, tente, en tant qu’attaquant à inclure sur la cible ZATAZ, situé en France, un payload localisé sur l’intermédiaire 195.114.18.99 (aka www.laubrotel.com) lui aussi situé en France.

Events source de 82.194.87.219 en relation avec le payload localisé sur l’intermédiaire 195.114.18.99 durant le dernier mois.

82.194.87.219, l’attaquant, a été vu la première fois le 2009-04-22 à 06:07:02 et la dernière fois le 2009-06-27 à 01:03:33, et à générer une totalité de 520 events. Celui-ci est en fait un serveur d’hébergement mutualisé (voir les sites référencés sur cette adresses IP) qui est aussi sûrement compromis de puis plus de 2 mois.

195.114.18.99, l’intermédiaire, a été vu la première fois le 2009-02-20 à 21:51:43 et la dernière fois le 2009-06-27 à 01:03:33, et à été impliqué dans près de 559 events. Le payload, toujours actif (http://www.laubrotel.com/letter/id?), est du à une mise à jour non effectué sur un Joomla. Ce site web est maintenant compromis depuis plus de 4 mois.

Nous voyons donc que l’intermédiaire, aka 195.114.18.99, a une durée de vie beaucoup plus grande que l’attaquant, ce qui sous-entend donc, que le payload a été utilisé au préalable par d’autres attaquant.

Vous pourrez trouvez donc ci-dessous, après un petit développement et une petite analyse tous les attaquants ayant été en relation avec l’intermédiaire 195.114.18.99.

Ce qui donne la représentation GoogleMap, de tous le cycle de vie de l’intermédiaire suivant.

L’on peut voir ici que cet intermédiaire a été utilisé par différents attaquants qui sont sûrement liés au même réseau.

Le prochaine billet portera sur une étude plus complexe du maillage des réseaux RFI.