Category Archives: Log Management

Log management comprises an approach to dealing with large volumes of computer-generated log messages (also known as audit records, audit trails, event-logs, etc.). Log management covers log collection, centralized aggregation, long-term retention, log analysis (in real-time and in bulk after storage) as well as log search and reporting. Log management is driven by reasons of security, system and network operations (such as system or network administration) and regulatory compliance. Effectively analyzing large volumes of diverse logs can pose many challenges — such as huge log-volumes (reaching hundreds of gigabytes of data per day for a large organization), log-format diversity, undocumented proprietary log-formats (that resist analysis) as well as the presence of false log records in some types of logs (such as intrusion-detection logs). Wikipedia definition.

Why and howto calculate your Events Per Second

Each time I ask a CISO, or a technological expert, on their number of events per second (EPS), I receive each time the same “No idea.“, “A lot of events“, “EPS WTF ?” answers. Most of actors are not sensibilized and/or don’t understand the key design factor of EPS metrics during the enumeration and scope design phase of a Log or Event Management (SIEM) project. Why are EPS metrics so important ?

EPS metrics usages

These EPS metrics will help you to determine and provide you responses to :

  • Acquire an appropriate Log or Event Management solution

Most of Log & Event Management vendors arguing that their products are supporting thousands of events per second. And surely their products are designed to support this number of EPS, and surely the vendor will ask questions about your EPS metrics. Most of time, if it is not an appliance, Log & Event Management solutions are supported by others tiers hardware and software’s. You will surely have a dedicated servers (with a limited amount of CPU, RAM & NIC), a SAN storage connexion (with a limited amount of size, I/O, speed, etc.), an attached external database (with all their own critical metrics), a backup solution, network bandwidth, etc. The EPS metrics will help you to design a part of your architecture and determine a part of your costs (CAPEX / OPEX). More EPS you will have more you will need an scalable and available architecture. If you acquire a Log or Event Management appliance solution, you will be limited de-facto by the vendor solution.

To not determine the EPS metrics during a Log or Event Management solution acquisition process, will surely make you acquire a solution how is oversized or undersized in front of your real initial scope needs. But never forget, EPS rate is only one factor to make the final selection of your Log or Event Management solution.

  • Respond appropriately to compliance’s and/or regulations

If you have compliance’s and/or regulations, how require Log & Event Management retention policies, the EPS metrics will help you to determine your online and offline storage requirements. Your retention policies period are indicated by compliance’s and/or regulations, but your storage requirements not. How many Giga or Tera bytes will you need to respond to your retention policies period ?

  • Improve your Capacity Management

During you day to day operation of your Log & Event Management solution, your storage requirements have to be monitored to ensure that the capacity meets current and future business requirements in a cost-effective manner. EPS metrics, based on a baseline, will help you to improve your application sizing, your performance management and to create a Capacity Planning.

Depending  on your EPS metrics, you will maybe have to redesign your technical infrastructure by adding clustering concept to your SIEM solution, creating an out-of-band network to deal with bandwidth limitations, etc.

  • Improve your Incident Management

Once you have an EPS baseline per device and/or per infrastructure, if you see an abnormal variation in your event rate flow, it will maybe indicate your that an unauthorized change has be done, or that a device has a misconfiguration, or that you are maybe under attack.

  • Improve your Service Level Management

As MSSP (Managed Security Service Provider), if you determine with your customer, during the scope definition, an EPS metrics baseline, it will be more easy for you to include EPS guaranties and/or limitations in the SLA. EPS metrics could be integrated in a SLA, same as for network bandwidth, and include concepts such as “burstable EPS“, “Peak EPS” and “EPS – 95th percentile“…

  • Provide some useful KPI’s

Once you have an EPS baseline, you will be able to gather some interesting KPI’s, for examples, total audited events during a period of time, EPS versus correlated events, etc.

And they are surely other good reasons to determine your events per second 🙂

EPS metrics definitions and methodology

The best definition of EPS metrics, I have read, are available in the SANS Whitepaper “Benchmarking Security Information Event Management (SIEM)” published in February 2009. I will do a recap of the metrics definitions and the methodologies on how to to create your EPS baseline.

They are two EPS metrics definitions :

  • Normal Events per second (NE) :The NE metric will represent the normal number of events usage time for a device, or for your Log or Event Management scope.
  • Peak Events per second (PE) :The PE metric will represent the peak number of events usage time for a device, or for your Log or Event Management scope. The PE represent abnormal activities on devices you create temporary peaks of EPS, for example DoS, ports scanning, mass SQL injections attempts, etc. PE metric is the more important cause it will determine your real EPS requirements.

Depending of the activities and your SIEM infrastructure, you will have these metrics for both activities, NE and PE for Log Management, and NE and PE for Event Management. A Log Management solution will have his own EPS limitations how are not the same as the Event Management solution limitations. This case is depending on your futur Log & Event Management infrastructure, if you will have a Log management solution in front of the Event Management solution, you will be able to filter out unnecessary events from the Log Management solution to the Event Management solution. I really recommend you to split the activities by dedicated solutions.

Also, to have valuable EPS metrics we recommend you to do analyse a period of 90 days of logs. The analyzed logs should represent all your normal and peak activities. If you analyse only a short period of time, your EPS metrics will surely not represent the truth.

Methodology :

  • Define your scope !

To define your initial scope, please ask you simple questions. What are your compliance or regulation requirements how need to be in the Log Management scope  ? What are the initial “Use Cases“, or policies, you will monitor through the Event Management solution, etc. The scope definition could be a dedicated blog post, so I will not explain further on how to determine this scope.

  • Scope devices inventory

Identify and do an inventory of all devices how should be integrated into your Log or Event Management scope. By your scope definition you will identify a certain number of required devices, some of these devices are running the same technology (for example : 4 Check Point firewalls, 2 Apache Web servers, etc). These identical devices don’t have the same roles and activities, so they will surely have a different EPS metrics.

  • Identify logs location and required events

For each device, identify the logs location, the logs retention period and in these logs file identify the required events to respond to the “Use Cases” or policies monitoring. In case of Log Management, please log everything. For Event Management, if you will have a Log Management solution in front of the Event Management solution, you will only need certain logs patterns. Identify these logs patterns and extract them into dedicated log files. Event Management is not to log everything, don’t consider your SIEM solution as a long term storage solution, the long term storage role is for Log Management.

You will then probably have 1 original log file for the Log Management scope, and one deviated log file for the Event Management scope.

  • Identify NE and PE metrics for devices and get the PE grand total

Here come the logfu and mathematics things. You will need some shell skills to extract all necessary information’s, and simple use Excel to analyse them.

Identify all your devices PE rates and sum all PE numbers to come up with a grand total for your environment. It is unlikely that all devices in your scope will ever simultaneously produce events at maximum rate.

Example of PE rate analysis

In this example (Google Docs), I have an IDS exposed to Internet, and I will do some statistical analysis. We will analyse 1 month logs to determine the PE metrics for this device. First gather the number of events per day and calculate you average and median EPS per day (Number of events per day / 86400 seconds). In this example I have an average EPS rate of 0.03 and a median EPS rate also equal to 0.03. But as you can see I have 12 days how have an average EPS rate above 0.03, and I have also one average EPS peak rate of 0.08.

We will zoom on the 2011-04-10 how as an average EPS peak rate of 0.08, to determine the exact average EPS peak rate for this day. The representation will be all events by minutes. We can see that the PE is located between 09:42 PM and 09:59 PM. We can also find that our PE rate, with a minute interval on the entire day, is now 6.27 (number of events per minutes / 60) and no more 0.08!

We will zoom in this time interval to identify more precisely our exact PE and we will represent all events per seconds. We can see that the real PE rate is equal to 12 and not 6.27 !

As described by this example, if you don’t analyse precisely logs, you will not able to determine your exact NE and PE rate. The PE grand total rate is clearly not representing a real PE rate, but will help you to not have a Log or Event Management solution how is undersized in term of EPS limitations.

ArcSight L750MB Logger Centos installation

Since ArcSight Protect 2010 in September 2010, the Logger model L750MB has been integrated in the ArcSight Logger product catalog. In our previous blog post we have analyse the Logger L750MB features and limits. We will resume here some of the features and limitations provided by L750MB and provide an installation guide for Centos 5.x

Features :

Connector appliance features are disabled.
Alerting module features are enabled.
Reporting module features are enabled.
SAN storage feature is disabled.
Logger peering features are disabled.

Limits :

10 devices maximum supported.
Maximum number of daily collected data is 750 MB
EPS rate is limited to a maximum of 60
maximum data retention is 50 GB

OS & Hardware requirements

You can install L750MB Logger on these following certified operating systems :

Red Hat Enterprise Linux (RHEL), version 5.4, 64-bit
Oracle Enterprise Linux (OEL) 5.4, 64-bit
CentOS, version 5.4, 64-bit

or on these others supported operating systems :

Red Hat Enterprise Linux (RHEL), version 4.x, 64-bit
CentOS, version 4.x, 64-bit

Virtual Machine installation of the above listed OS is supported. You will not able to install the Logger on an existing machine how is running MySQL or PostgreSQL. We recommend you a complete dedicated operating system for the installation. You will also need a synchronized NTP for all your infrastructure. A synchronized time is a key factor for Log Management. After the installation you will need one of the following supported browser, with Adobe Flash Player plug-in :

Internet Explorer: Versions 7 and 8
Firefox: Versions 3.0 and 3.5

For hardware requirements we recommend you :

CPU : 1 or 2 Core
Memory : 4 – 12 GB
Disk Space : 120 GB

Storage strategy & retention policy requirements.

As ArcSight Logger L750MB has a limit of 50GB maximum data retention, your storage strategy and retention policy will be simple to define, just follow the ArcSight recommended installation,  and then we will change it by the ArcSight Logger Web interface.

By the recommended installation ArcSight Logger will initialize the Storage Volume to the maximum authorized, aka 50 GB, and the Storage Volume has to be on local disk, on a NFS, or SAN mount point. You will not be able to increase the size of the Storage Volume above 50GB with the L750MB, and once the Storage Volume size is configured the only way to resize the Storage Volume is to reinstall every thing.

Also, with the recommended installation ArcSight Logger will initialize the maximum of 6 Storage Groups. Two of these Storage Groups are inherent to the Logger and are named “Default Storage Group” and “Internal Event Storage Group“. if you choose to not create the maximum of 6 Storage Groups, you will not further able to create more Storage Groups. Here under the default Storage Groups configuration :

[TABLE=14]

You will be able to resize all Storage Groups, we recommend you to, until you understand the concept of “Devices”, “Device Groups” and “Storage Rules”, to not touch the “Internal Event Storage Group” definition and to provided the maximum size to the “Default Storage Group“. You will have then this configuration :

[TABLE=15]

Installation

First of all you will need an updated Centos 5.4 installation, just follow the Centos installation procedures. You will need to configure IP addresses, DNS and NTP configuration before starting the Logger installation procedure. As ArcSight Logger

Create an arcsight user and group :

ArcSight user add
ArcSight user add

Give a password to the arcsight user :

ArcSight user password

Upload “ArcSight-logger-5.0.0.5355.2.bin” installation binary and your “arcsight_logger_license.lic” license file in the arcsight home directory.

Make the installation binary executable :

ArcSight Logger chmod

To install the Logger in console mode execute the following command :

ArcSight Logger Console mode installation

On the first prompt press enter to display the license agreement and accept the terms of agreement.

ArcSight Logger licence agreement

Provide the installation directory, in “/home/arcsight”, and then press enter to begin the continue the installation.

ArcSight Logger installation folder
ArcSight Logger installation

After the end of the installation, you will need to press “enter” to initialize the Logger. This initialization may take several minutes.

ArcSight Logger initialization
ArcSight Logger successful initialization

When initialization is done you will have to configure the Logger, by a configuration wizard. To start this wizard in console mode, please type the following command.

ArcSight Logger configuration
ArcSight Logger configuration in console mode

The license file location will be asked.

ArcSight Logger License file

Choose the typical installation type if you are not familiar with ArcSight Logger indexing, storage groups, and storage volume. Also don’t forget that the L750MB will not permit you to go above a theoretically 50GB storage. As described above we will change to Storage Groups settings further.

ArcSight Logger installation type

When the complete configuration is finished we recommend you to not start directly the logger and reboot the server.

ArcSight Logger installation startup

After the reboot log you on the server with the arcsight user to start the logger with the following commands.

ArcSight Logger startup after reboot

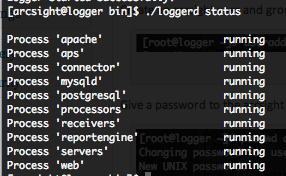
The “loggerd” command is located in “/home/arcsight/current/arcsight/logger/bin” directory. If the startup is successful you will have this return.

ArcSight Logger loggerd status

The “loggerd” command can have these following arguments.

ArcSight Logger loggerd arguments

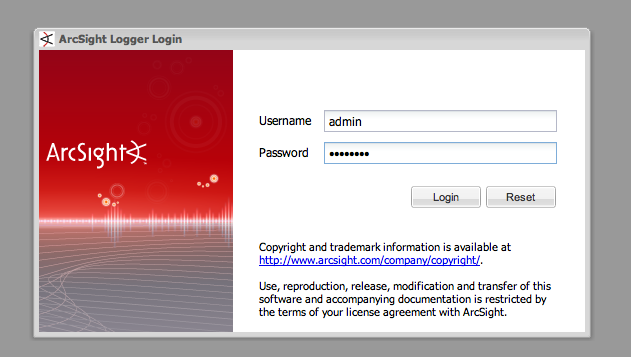
Now you can log in ArcSight Logger Web interface on port 9000 with https and you will have the following login page.

ArcSight Logger login page

The default login is “admin“, and the default password is “password“, please change it 🙂 To change your password just go in the “System Admin” menu, then in the “Change Password” sub-menu.

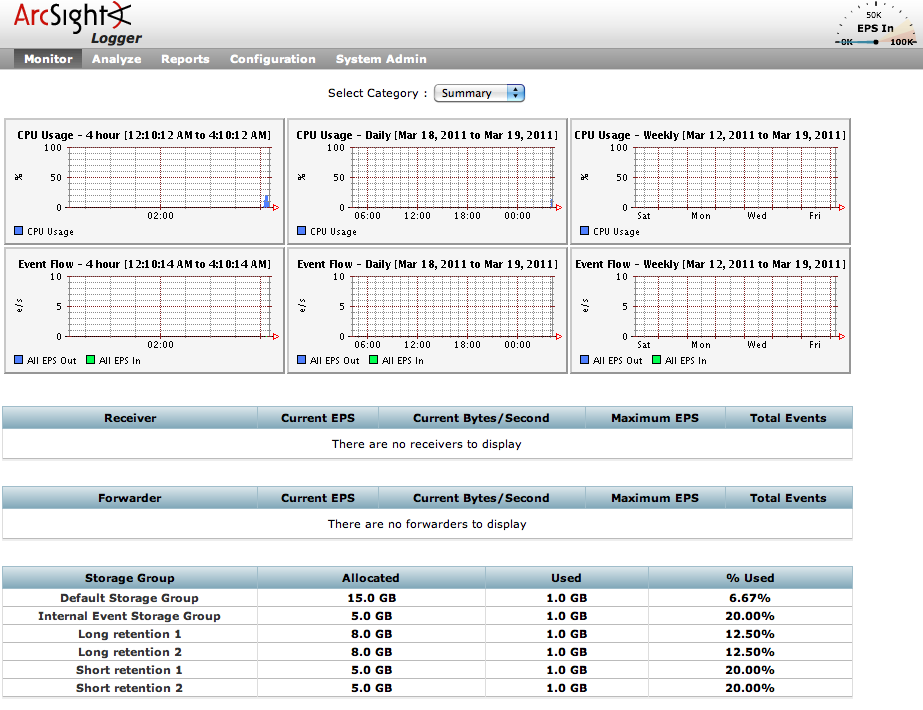
ArcSight Logger Web user interface

To change the Storage Groups settings just go in the “Configuration” menu, then in the “Storage” sub-menu.

You have now an up and running logger, in a next blog post we will install the L750MB SYSLOG SmartConnector on a dedicated Linux server and the “SNARE” software on Windows to have  our first events.

ArcSight L750MB Logger features and limits

ArcSight L750MB Logger is now for free, since 16 August . A good occasion to discover this Logger version and to better know the provided features and limits of this product.

After the registration, no CCN is asked, with the promotional code, you will receive two separate emails. One will give you access to the ArcSight Download Center, and one hour latter you will receive your free licence key attached to the second email. Hopefully since, two or three weeks registrations are also allowed for users how are outside US & Canada.

From the ArcSight Download Center, you will be able first to download :

  • The latest version of ArcSight L750MB Logger – 5.0 Patch 2 (5.0.0.5355.2) – 438.8 MB.
  • All L750MB related documentations (Administrator Guide, Quick Start, Release Notes & the Software Licence Agreement).
  • Limited ArcSight Syslog SmartConnectors for Linux and Windows (229.4 MB for Linux and 187 MB for Windows).
  • All the limited Syslog SmartConnectors documentations.

Supported Plateforms & Browsers

Certified Operating Systems for ArcSight L750MB Logger installation are :

  • Red Hat Enterprise Linux (RHEL), version 5.4, 64-bit
  • Oracle Enterprise Linux (OEL) 5.4, 64-bit
  • CentOS, version 5.4, 64-bit

Other supported Operating Systems are :

  • Red Hat Enterprise Linux (RHEL), version 4.x, 64-bit
  • CentOS, version 4.x, 64-bit

Virtual Machine installation of the above listed OS is supported. You will not able to install the Logger on an existing machine how is running MySQL or PostgreSQL. We recommend you a complete dedicated Operating System for the installation.

Supported browsers are, with Adobe Flash Player plug-in :

  • Internet Explorer: Versions 7 and 8
  • Firefox: Versions 3.0 and 3.5

For the Hardware requirement :

  • 100 GB disk space will be enough cause the L750MB Logger has a 50 GB maximum compressed log (10:1) restriction.
  • Minimum of 2 GB memory, but better 4 GB to gain the advantages of the 64 bits OS.
  • 1 to 2 CPU cores are enough due to others L750MB limitations.

L750MB provided SmartConnectors

SmartConnectors will provide you the ability to send CEF normalized and aggregated events to the Logger. To use SmartConnectors with ArcSight Logger you need to create a “Smart Message Receiver” on the Logger.

I was surprised to see that the SmartConnectors provided with the L750MB Logger version are very limited in term of number. Normally ArcSight cover with his SmartConnectors technology around 250 different products. With L750MB you are able to install and use the following SmartConnectors :

  • Cisco PIX/ASA (an average of 200 bytes per event)
  • Cisco IOS Routers and Switches (an average of 150 bytes per event)
  • Juniper Network and Security Manager (NSM) (an average of 300 bytes per event)
  • Juniper JUNOS Routers and Switches (an average of 300 bytes per event)
  • Red Hat Enterprise Linux (an average of 150 bytes per event)
  • SNARE (an average of 800 bytes per event, depending on the Windows OS)
  • Snort (an average of 200 bytes per event)

In addition or without SmartConnectors you could use the following others Logger Receivers :

  • Syslog (UDP or TCP)
  • File Transfer in SCP, SFTP or FTP.
  • CEF TCP or UDP

The File Receiver is disabled cause the L750MB Logger don’t allow you to mount NFS, CIFS or SAN shares.

L750MB Features, Limitations and Restrictions

Features :

  • Connector appliance features are disabled.
  • Alerting module features are enabled.
  • Reporting module features are enabled.
  • SAN storage feature is disabled.
  • Logger peering features are disabled.

Logger limits :

  • 10 devices maximum could send they logs to the L750MB Logger. A device is the IP of the event generator. For example, you could have a Linux box with Syslog and Snort, the 2 events sources will be considered coming from the same generator IP. Also, the device, on the Logger, is a combination of a generator IP and a Receiver. We recommend you to use the same Receiver for common events sources on the same generator IP.
  • The maximum number of daily collected data is 750 MB. The sum of the size of the original events is used to determine this value. 750 MB represent, with a 300 bytes event average size, 2 621 440 events per day ((750 * 1024 * 1024) / 300).
  • The EPS rate is limited to a maximum of 60. So you will have a maximum of 5 184 000 events per day (60 * 86 400). But the 750 MB limit will stop you before you will reach the 60 EPS if you are running SmartConnectors like SNARE or Juniper.
  • The maximum data retention is 50 GB with a compression rate of 10:1 (500 GB). But the Logger need an “Internal Event Storage Group” of 5 GB, so your total of maximum data retention is more less than 45 GB (450 GB).  This compression rate will permit you to store around 1 610 612 736 events ((450 x 1024 x 1024 x 1024) / 300). This total amount of events compared to the 750 MB limit will permit you to have a retention period of 614,4 day’s (1 610 612 736 / 2 621 440).

If the limit of 750 MB per day is exceeded, the software version of Logger continues to collect and store events. However, if this limit is exceeded 5 times (5 days) in a 30 day sliding windows, you will no more able to run “Searches” or run “Reports” on the collected events until the 30 day sliding window contains 4 or less data limit violations. A warning message will be displayed when a data limit violation occurs. You can also view the data limit violation information on the License information page.

ArcSight L750MB Logger is really a good solution for SMB companies how don’t have necessary lot of devices, but the limitation in supported SmartConnectors is a point how will maybe encourage IT guys to select a product with more native supported products.

Thanks for Christophe Briguet for its Log Caliper Iphone/Ipad application 🙂

Honeynet Forensic Challenge 5 Log Mysteries – Analysis – Part 2

Following my last post “Part 1 : SSH activities forensics“, I continue to analyse the SSH activities.

Emerging Threats is defining a default “SSH Brute Force” rule, “2001219“, with these triggers :

  • The source IP should be the same
  • The destination port should be 22/tcp
  • The sensor target should be unique (not the ssh server)
  • The thresholds are 5 matching conditions within 2 minutes

Emerging Threats rule don’t care about :

  • If multiples SSH server are in the same $HOME_NET
  • If the targeted user name is unique or not

ArcSight is defining a default “Brute Force Logins”, with these triggers :

  • The source IP should be the same
  • The target IP should be the same
  • The target port should be the same
  • The target username should be the same
  • The thresholds are 5 matching conditions within 2 minutes

We will then consider that 5 matching conditions within 2 minutes by the same source IP as our trigger to detect a SSH brute force attack.

First, we will check the stats for each source IPs how have fail to access the box and never succeeded (third Google gadget).

All the failed SSH connexions uper or equal to 5 in a timeframe of 120 seconds will be considered as this kind of attack.

The detailed stats are avaible in this Google Document under the “SSH – 5” worksheet.

On 25 source IPs, how have fail to access the box and never succeeded, 19 would be detected by ET 2001219 rule.

4 of the 6 source IPs, non detected as a brute force attack, with a number of connexion uper than 20 are interesting, it is a real non detected brute force attack.

On ArcSight, with the default “Brute Force Logins” correlation rule, only 13 on 25 source IPs would be detected as a brute force attack.

Now we will do the same analysis for each source IPs how have fail to access the box and finaly succeeded (second Google gadget).

All the failed SSH connexions uper or equal to 5 in a timeframe of 120 seconds will be considered as this kind of attack.

The detailed stats are avaible in this Google Document under the “SSH – 6” worksheet.

On 7 source IPs, how have fail to access the box and never succeeded, 6 would be detected, by ET 2001219 rule.

On ArcSight, with the default “Brute Force Logins” correlation rule, only 4 on 7 source IPs would be detected as a brute force attack.

More the “Brute Force Attacks” attempts are distributed in time, more patient you are, more you switch between a few targeted user accounts, less you will be discovered. ArcSight and Emerging Threats default rules will detect nothing.